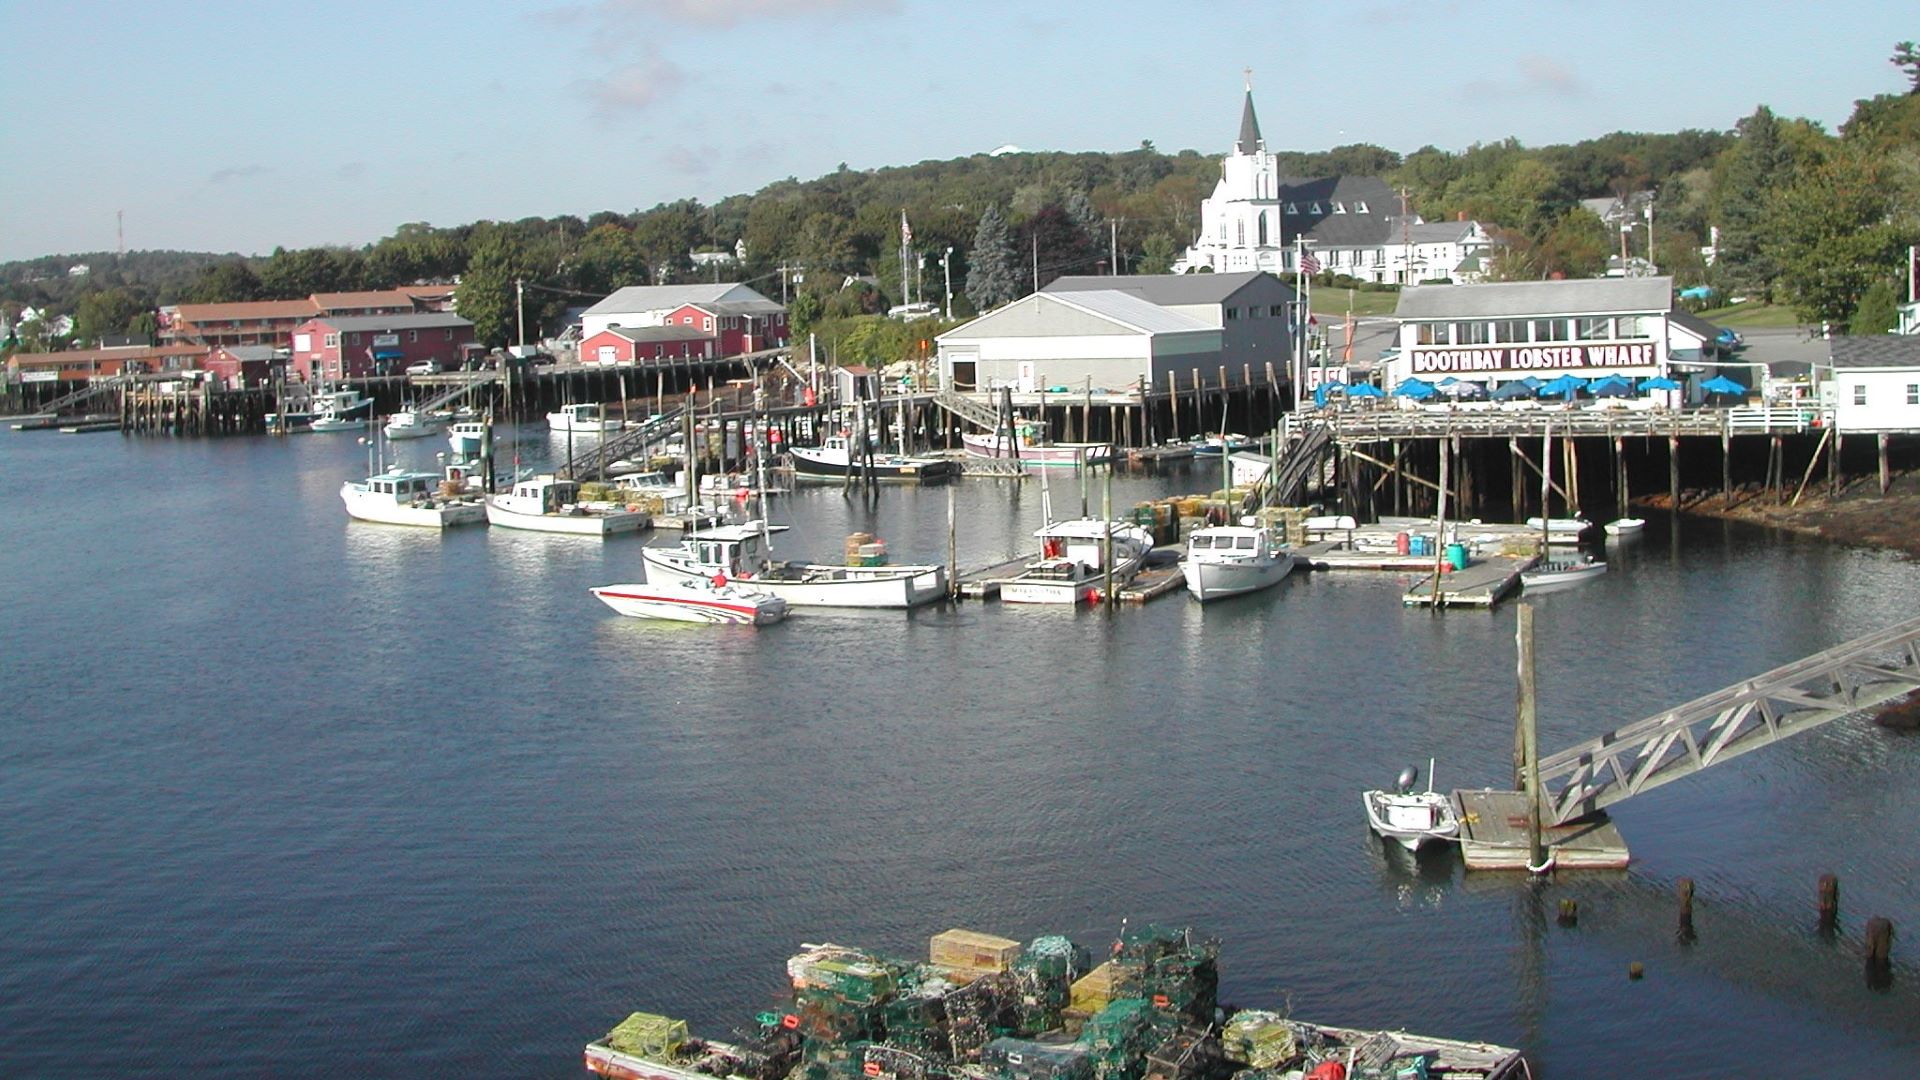
Maine’s Department of Marine Resources has maintained a hidden treasure in Boothbay Harbor for nearly 120 years — a daily measurement of sea surface temperatures, which provides an uncommonly long record of a warming ocean.
In the latest Data Monitor, we broke those daily records (more than 42,000 of them!) into annual averages to show the estimated increase in water temperatures at Boothbay Harbor between 1905 and 2021. It shows a rough increase of 4 to 5 degrees Fahrenheit on average, from an annual average of 45.3 degrees F (or 7.4 Celsius) at the turn of the 20th century to just over 50 degrees F in recent years.
One important caveat on this data: DMR’s method for collecting the water temperatures in the harbor changed around 1950. Before, measurements were taken three times a day, during the day, using a thermometer in a bucket lowered into the water. In the 1950s, this was replaced with instruments installed just below the surface to take continuous measurements.
“While the early bucket measurements are useful for understanding broad temperature trends, especially given the length of the dataset, the measurements after 1950 are better for looking at trends on a finer scale and are more comparable to modern datasets in other parts of the world,” said Jesica Waller, the director of DMR’s Division of Biological Monitoring & Assessment, in an email.
This means there is a limit to how closely we can compare early and later measurements in this data set without more detailed analysis. However, we do know broadly that ocean temperatures have risen — since the Industrial Revolution, when humans began burning fossil fuels and emitting greenhouse gases on massive new scales, and even more quickly since the 1970s.
RELATED: A historical look at the impact of climate change on Maine’s temperatures
So there’s a lot to be learned from this kind of long, detailed temperature record — especially in the Gulf of Maine, which is one of the fastest-warming parts of the world’s oceans.
“This dataset is one of the longest continuous ocean temperature records in the world and is a key resource to evaluate rising temperatures in coastal Gulf of Maine waters,” Waller said in an email. “DMR researchers and scientists across the world use this unique dataset to better understand the history of our ecosystem and forecast the future.”
The Maine Climate Council used the Boothbay Harbor dataset in its 2020 Scientific Assessment of Climate Change and Its Effects in Maine (pages 65 and 176), which is a key part of the state’s climate action plan. Warming waters are a major contributor to coastal sea level rise, worsening storms and other harms to marine ecosystems and fisheries from climate change.
Another example of an application for this data is in the shorter-term spike in temperatures seen in the 1950s, which had myriad effects on fisheries, invasive species and more. Researchers today can compare the effects of this episode to those of longer-term, human-caused warming.
Dave Reidmiller, who directs the Climate Center at the Gulf of Maine Research Institute, said in an email that long-term datasets like this one help scientists separate “signal” from “noise” to find trends. Since natural processes can take decades to occur, he said, it takes many decades of data to accurately discern what’s natural and what’s the result of human activities.
This data can also be used to improve climate models, giving scientists more confidence in their projections about the next century of warming or sea level rise.
“Computer models that simulate the Earth system … are only as good as the environmental data that goes in to them,” Reidmiller said. “Long-term observational datasets provide scientists with the information needed to test how well their models can simulate historical conditions.”


